Module 2#
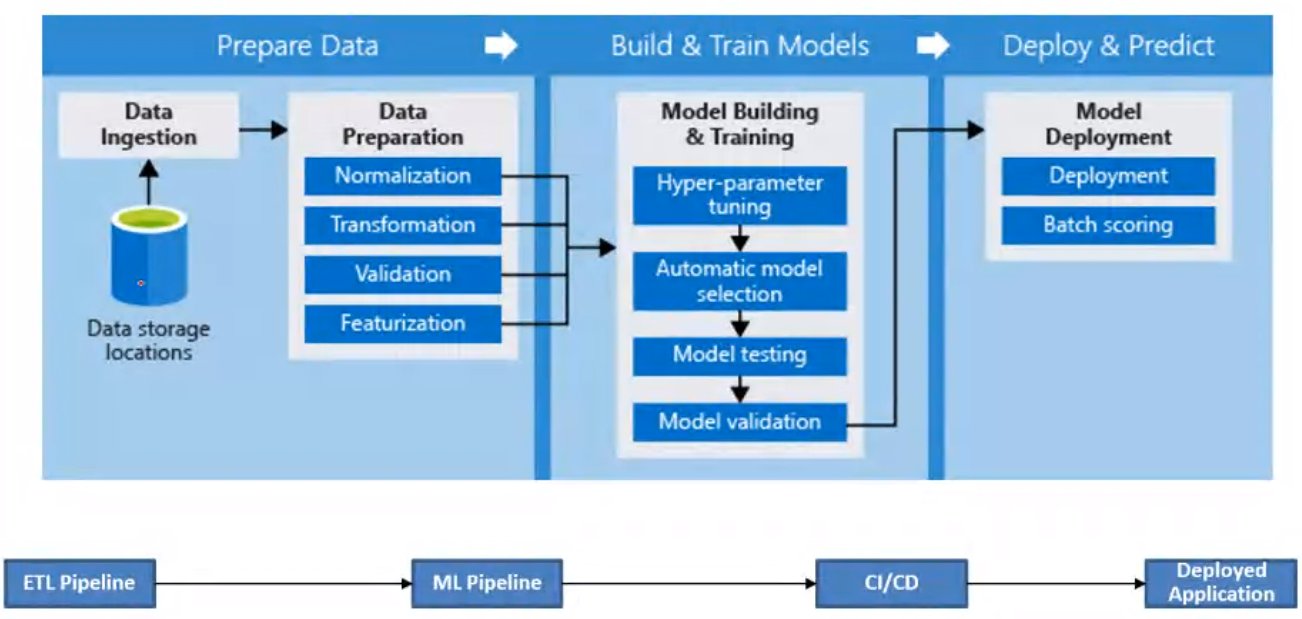
Machine Learning Pipeline#
- Framing a machine learning problem
- Get the data
- Data Pre processing
- Data Visualization and Analysis
- Feature Engineering
- Model Building and Evaluation
- Fine tune the model
- Present the solution
- Launch, monitor and maintain
Case Study#
Bank is loosing too much money due to bad loans and wants to reduce losses. The following things are looked at to frame the problem
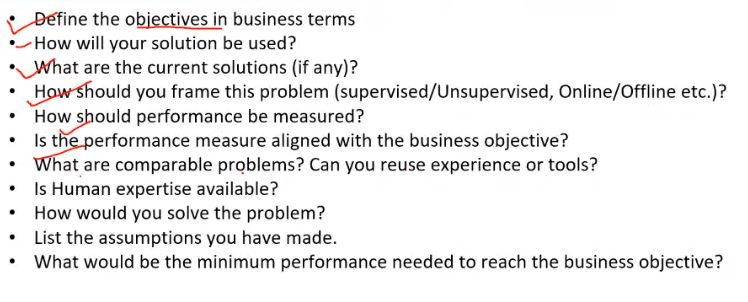
Frame the problem#
- Define the objectives in business terms
- How will your solution be used
- What are the current solutions
- How should you frame this problem (Supervised or unsupervised)
- How should the performance be measured
- Is the performance measure aligned with the business objective
- What are comparable problems
- Is Human expertise available
- How would you solve the problem?
- List the assumptions you have made
- What would be the minimum performance needed to reach the business objective?
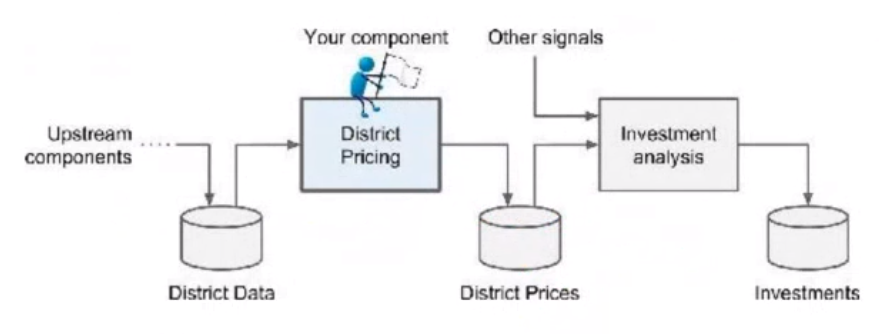
An example problem statement#
- Build a model of housing prices using census data
- Data attributes
- Districts are the smallest geographical unit (population ~600-3000)
- Data attributes
- The model to predict the median housing price in an district, given all the other metrics
- Goodness of the model is determined by how close the model output is wrt actual price for unseen data.
Framing the problem#
- What is the expected usage and benefit?
- Impacts the choice of algorithms, goodness measure, and effort in lifecycle management of the model
- What is the baseline method and its performance?
-
Analyze the dataset
- Each instance comes with the expected output
- Hence we are going with supervised
- Goal is to predict a real valued price based on multiple variables line population, income etc
- Regression is chosen for this reason
- Output is based on input data at rest, not rapidly changing data rapidly.
- Dataset small enough to fit in memory
- Batch
- Since we are predicting a single value we are calling it a univariate problem
-
Choice of Performance metrics
- Root Mean Square

- Mean Absolute Error (MAE)
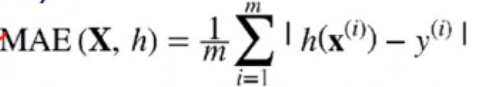
- Root Mean Square
-
Types and properties of attributes
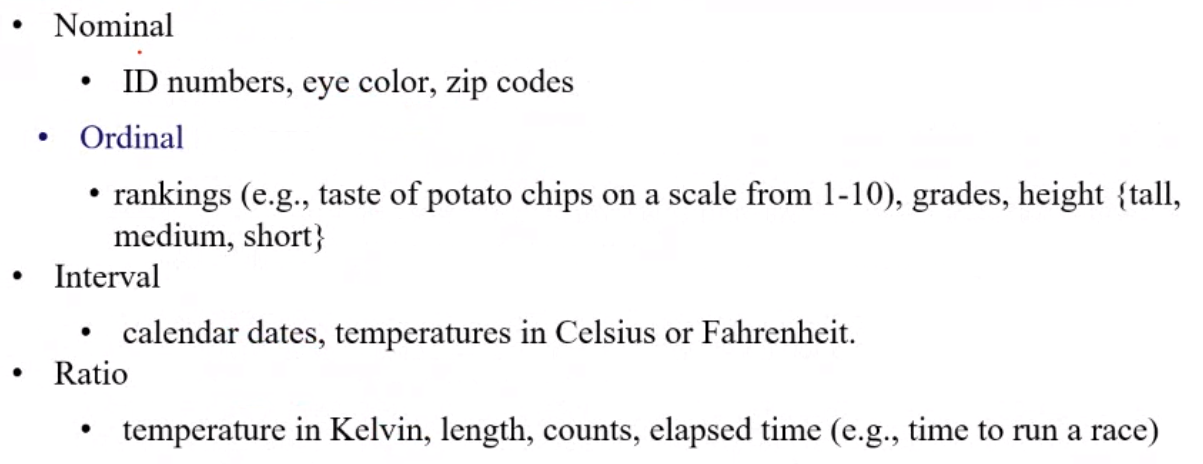
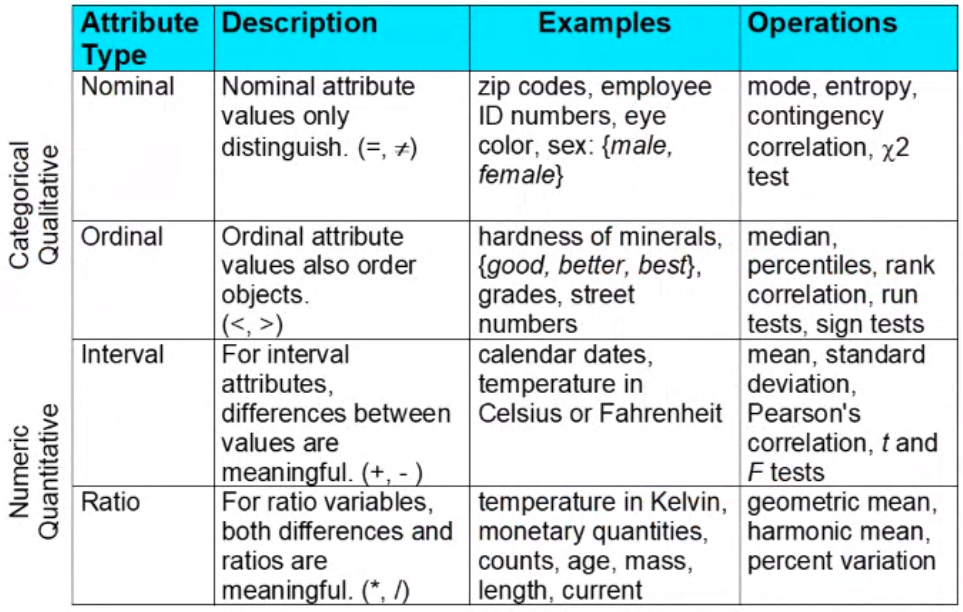
Data types of attributes#
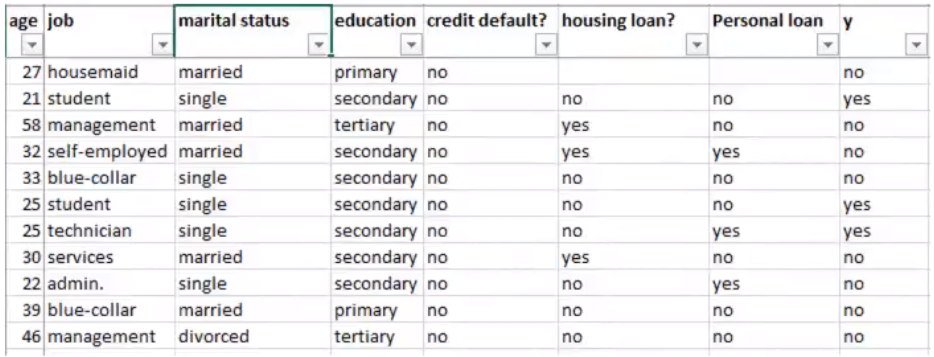
job, marital -> nominal
education -> Ordinal
credit default -> Binary (symmetric)
housing loan -> Binary
- Categorical
- Binary
- Symmetric (Simple matching coefficient proximity measure)
- Asymmetric (Jaccart coefficient proximity measure)
- Nominal
- Numerical/continuous (Minkowsky distance for proximity measure)
- to find outliers
Some pandas functions#
df.types() # Get the datatypes of all columns in dataframe
df.info() # Get more info on non null values in data frame
df.describe() # Get statistical summary of each attribute and 5 point summary of numberic attributes
Data Types#
- relational/Object data
- Transactional data
- Document data
- Web and social network data
- Spatial data
- time series data
Note: Topics such as data types, pre processing, visualization and analysis are explained well in Jupyter Notebooks
---------------------------------#
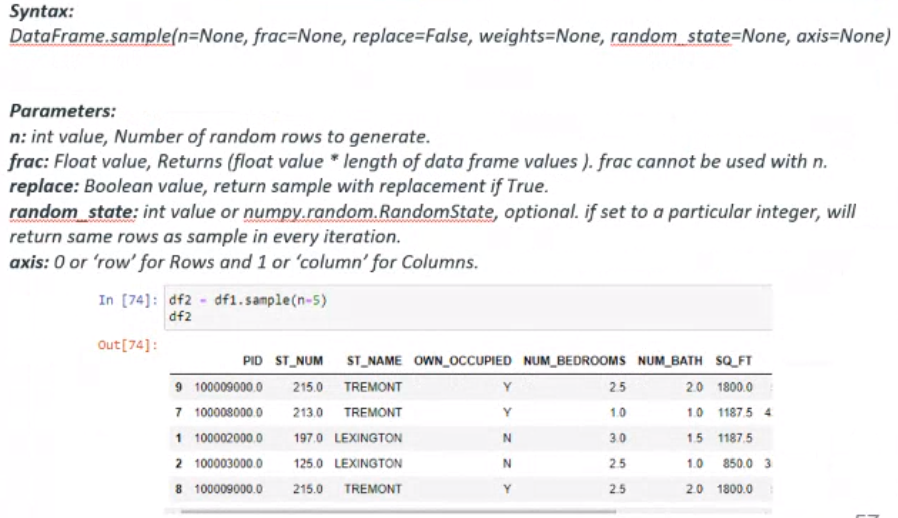
Sampling#
Binarization#
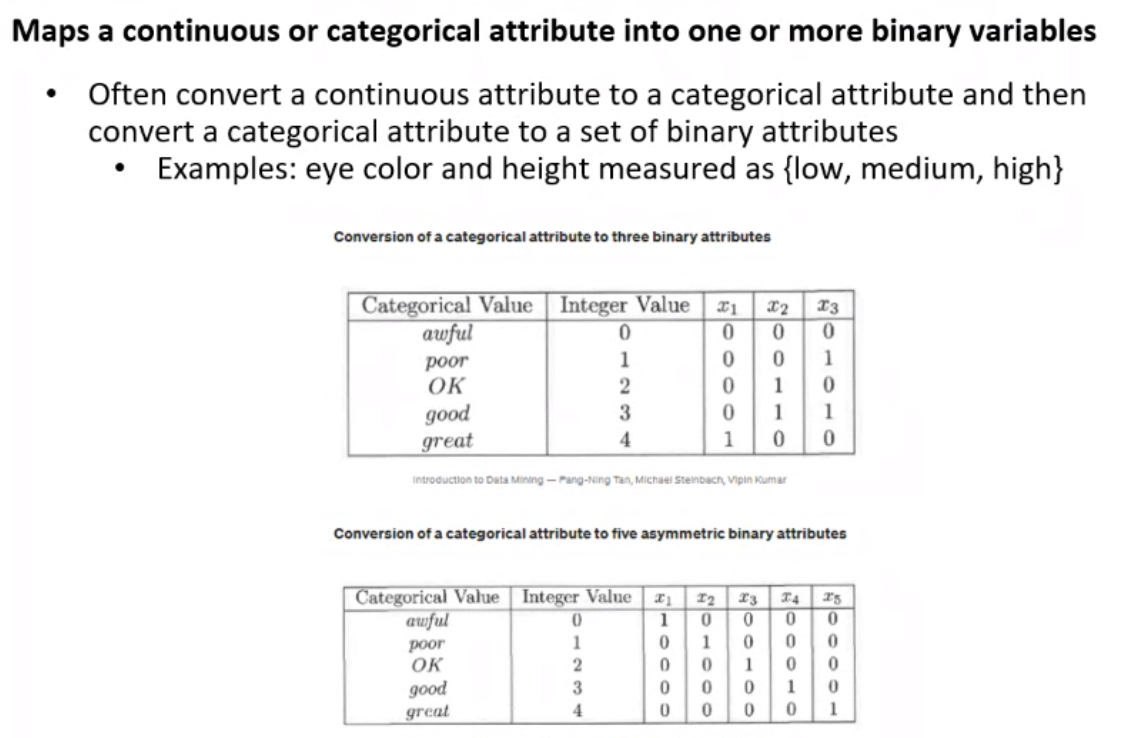
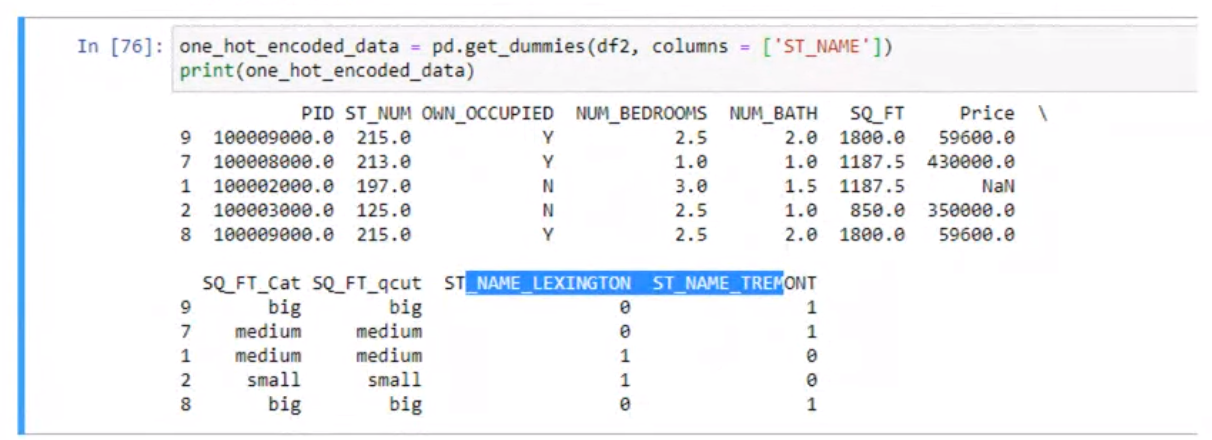
One Hot Encoding#
Attribute Transformation#
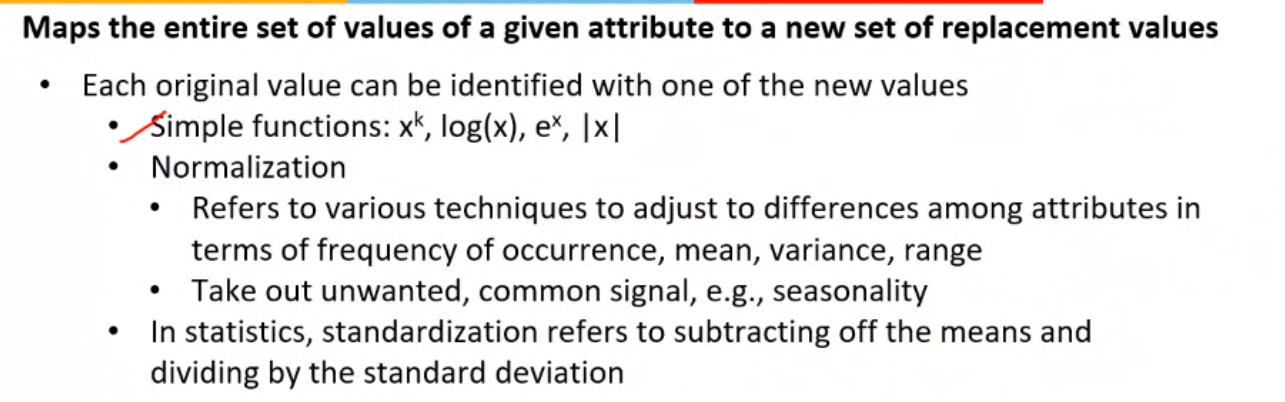
- This is done to reduce skewness in data.
- Transformation is done to bring data to the same scale that helps in feature scaling
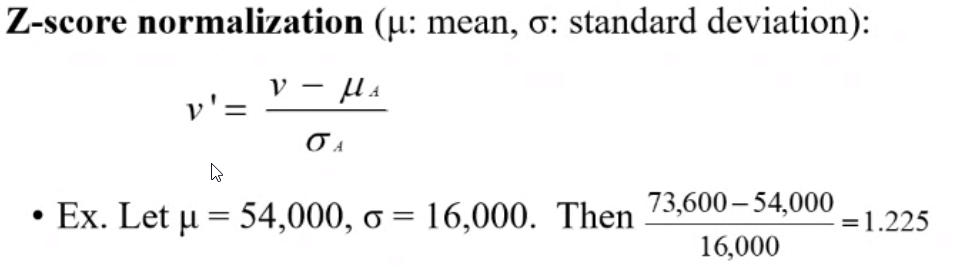
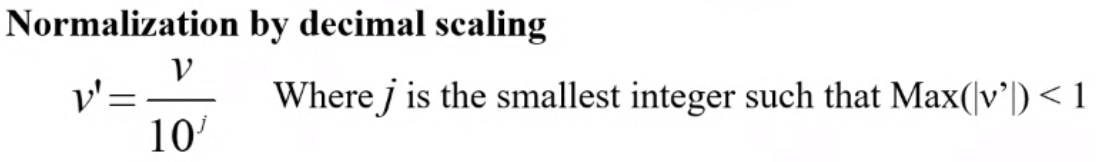
Normalization#
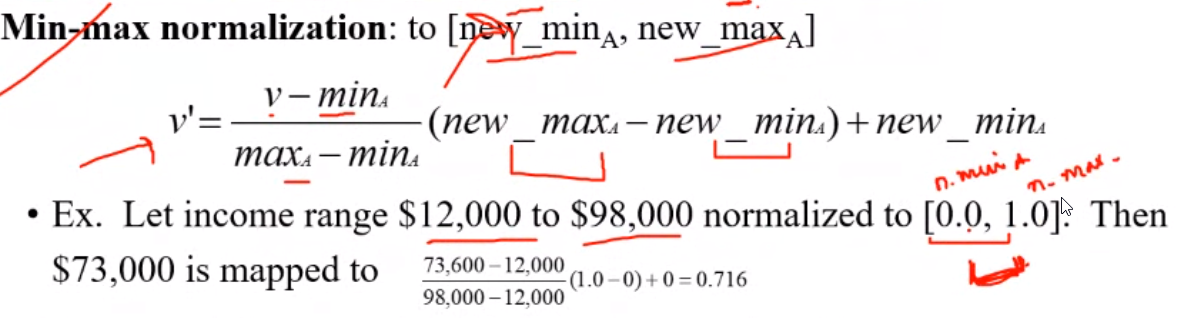
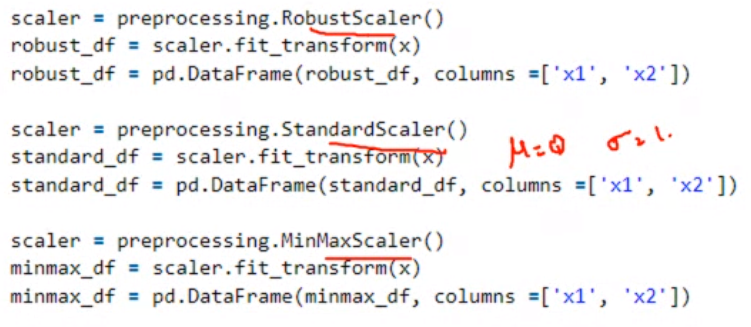
Robust scaler normalizes withing the IQR (Q3 - Q1)
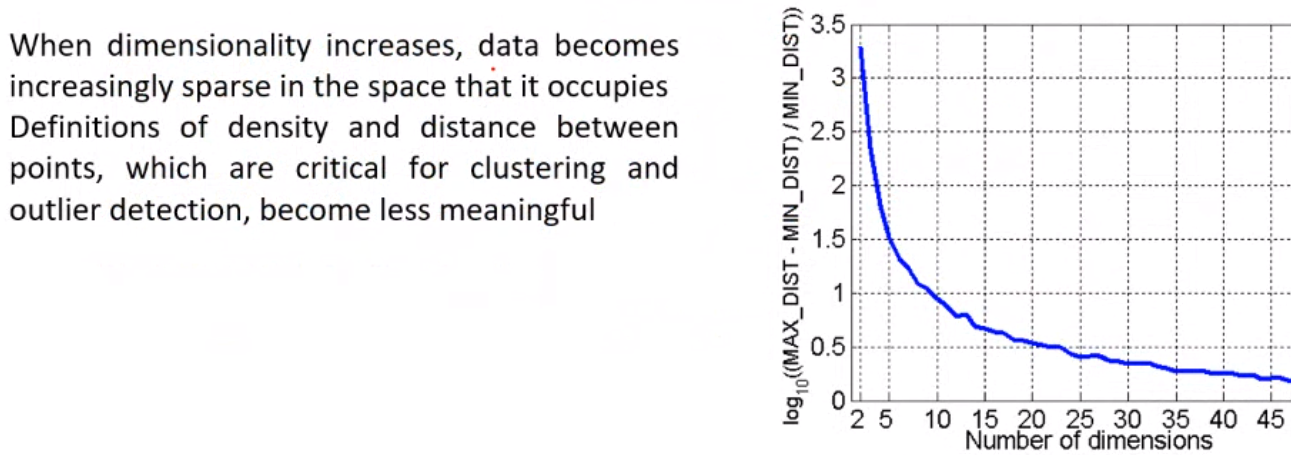
Curse of Dimensionality#
Dimensionality Reduction#
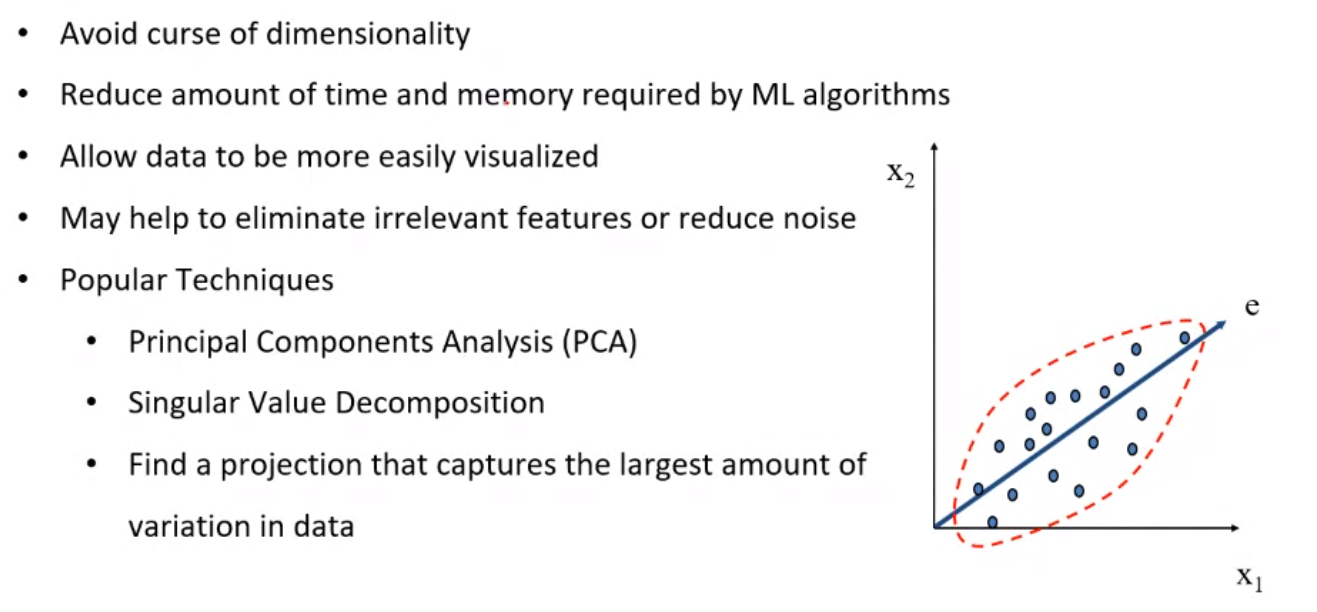
- PCA: 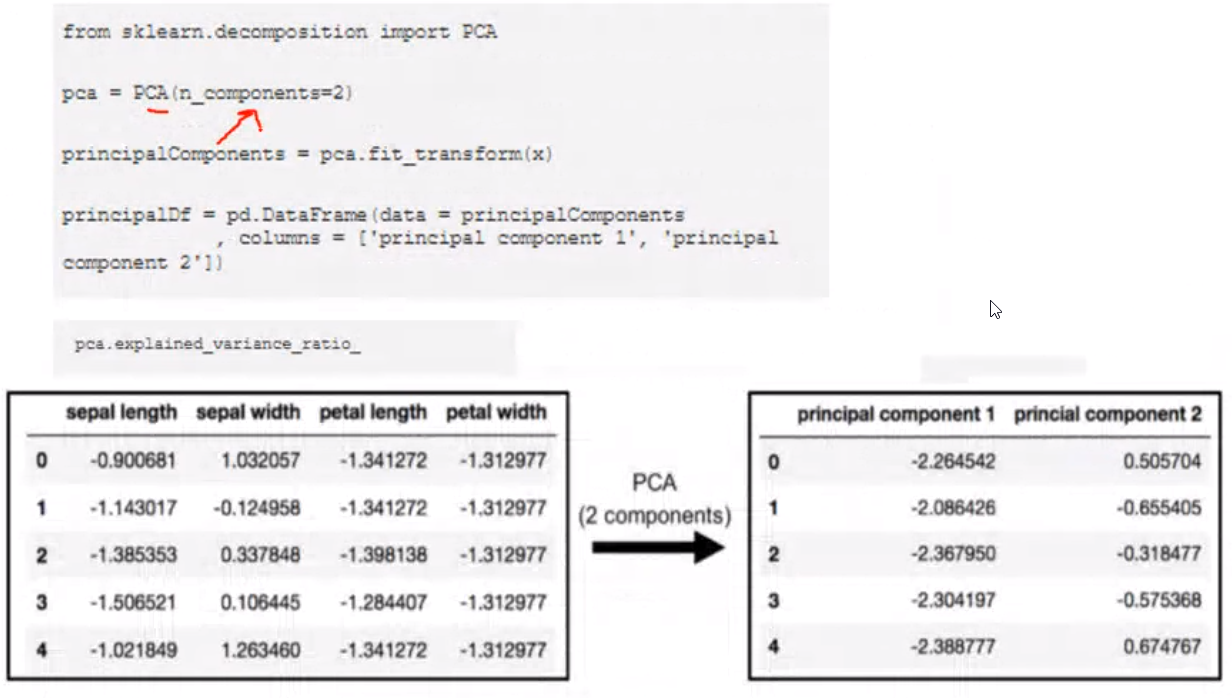
- Other ways to reduce dimensionality: 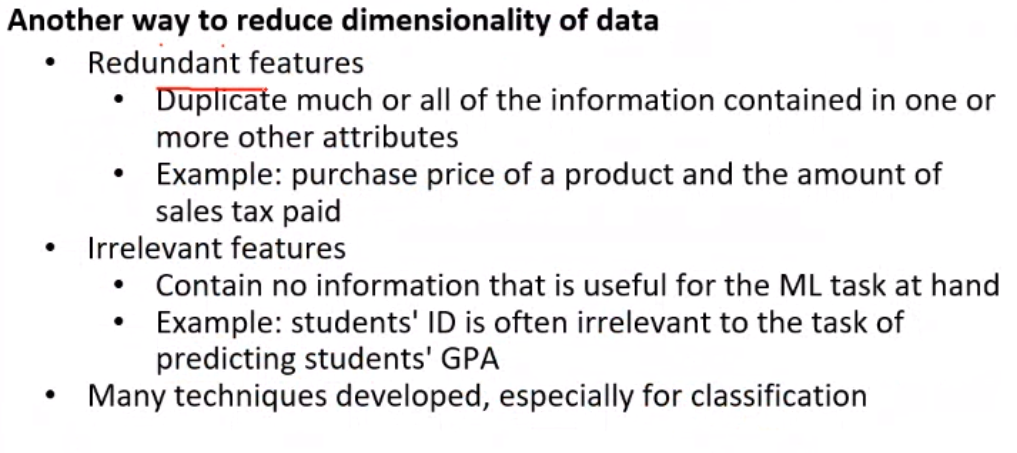
- Correlation Decision:
- Chi Square Stats (Categorical attributes)
- Pearson Coefficient (Numeric attributes)
- Annova Test (Mixed attributes)
- Wrapper Method is to train models with several subsets of data and choose the one that was most fruitful do then do further improvement on that.
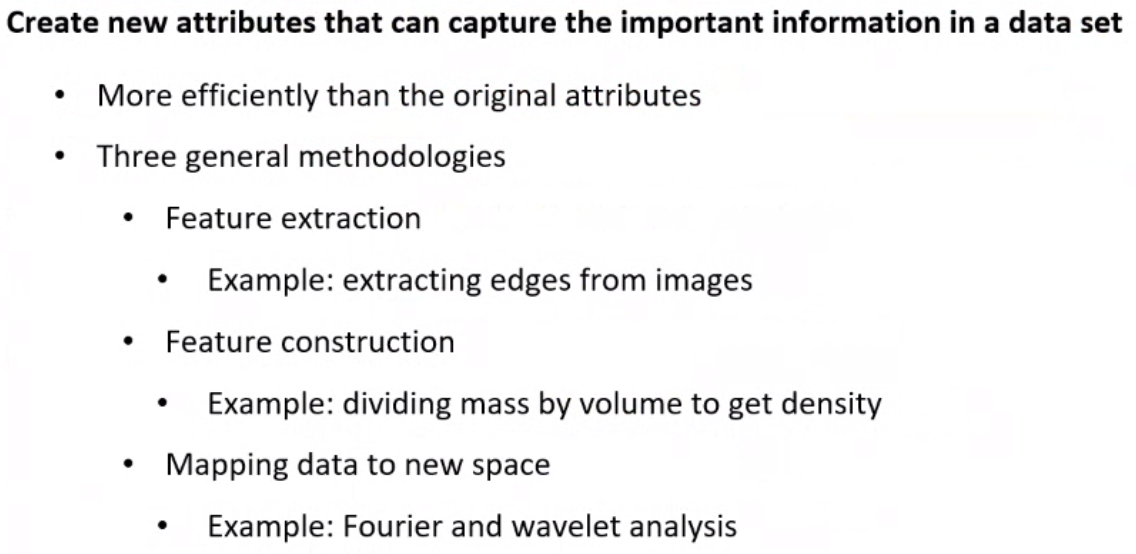
Feature Creation#
Tags: !AMLIndex
Tags: !AMLIndex