Module 5#
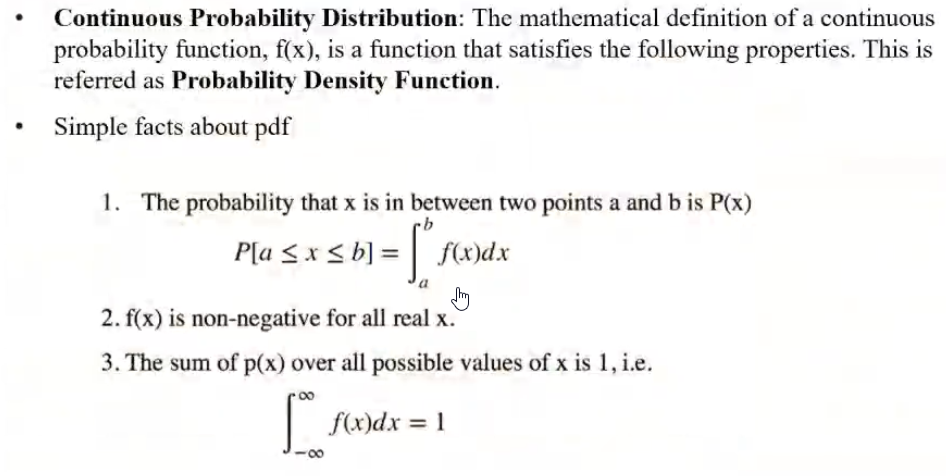
Model Evaluation Parameters#
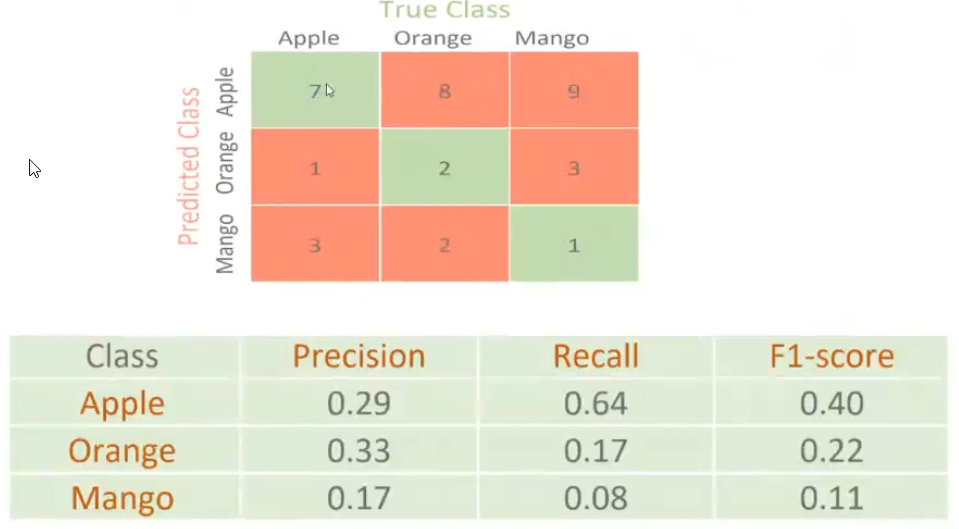
Precision#
What percentage of tuples that are positive are actually positive
\(Precision = \frac{True Positives}{True Positives + False Positives}\)
Recall#
What percentage of positive tuples did the classifier label as positive
\(Recall = \frac{True Positives}{True Positives + False Negatives}\)
F Measure#
Harmonic mean of precision and recall
\(F = 2 \times \frac{precision \times recall}{precision + recall}\)
High values of \(F_1\) score indicates that both the precision and recall both are high
\(F_\beta\) is the wighted measure of precision and recall. Here we assign \(\beta\) times as much to weight to recall as to precision. This is done if either recall or precision is more important than the other.
\(F_\beta = \frac{(1 + \beta^2) \times precision \times recall}{\beta^2 \times precision + recall}\)
Things to note#
- Accuracy is useful when data is balanced and all tuples are almost equally occurring
- If the data is imbalanced (When the tuples of a particular category are very little) then we lean on precision and accuracy as a better metric for measuring the model performance
- To artificially create instances for the minority class to balance the data
sklearnhas asmoatlibrary that helps us in achieving the same.
Holdout and Cross validation#
Hypermarameters are those that controls the learning process. To know this we need to use cross validation
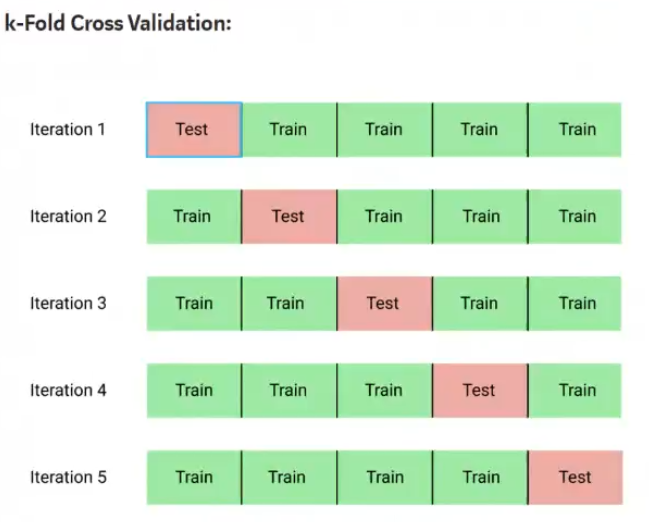
We train the model k number of times with different subsetting of train and test samples
The above is trained with taking a param as a hyperparam. We calculate the avg accuracy of the k models and assign the score for that hyperparam and repeat all these steps for other params as hyperparams and see which one has the best score. This helps us getting to know what the hyper parameter is.
ROC AUC Curve#
- ROC is a probability curve between TPR and FPR to show their tradeoff
\(TPR = \frac{TP}{TP + FN}\)
\(FPR = \frac{FP}{TN + FP}\)
- AUC shows degree of separateability. It shows how good a model is capable of distinguishing between classes
- Higher AUC means better the model is at predicting
- AUC of ROC evaluates model performance on average.
- For model comparison, AUC of ROC should be larger for the model to be superior or better performing.
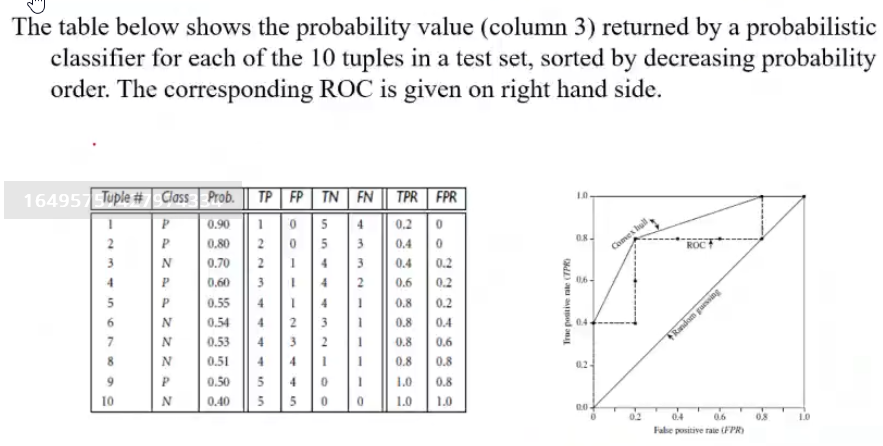
In python we can use sklearn's predictProba to calculate the probabilities that are required for plotting the ROC curve.
Checking for correlation between features#
- We check how a given feature is correlated to the result. If they are not then we can drop them entirely
- Similarly we check how correlated the features are to other features
Random Variables#
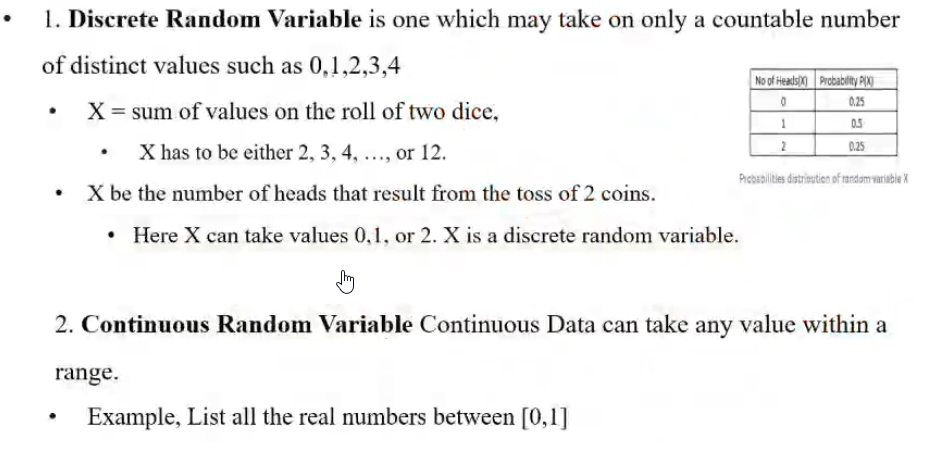
Continuous Random Variable#
Gaussian Distribution#
- It is a symmetric distribution that is bell shaped
- It is symmetric around the mean
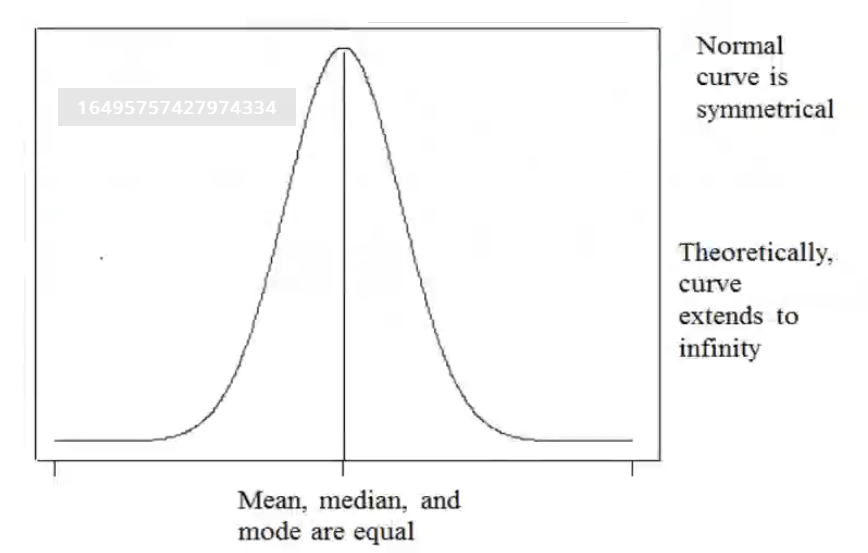
- \(f(x) = \frac{1}{\sigma \sqrt{2\pi}}\cdot e^{-\frac{1}{2}(\frac{x - \mu}{\sigma})^2}\)
- The mean \(\mu\) and the standard deviation \(\sigma\) decides the shape of the curve
Note: Topics such as Conditional probability, Independence, Law of total probability and Bayes theorem are extensively discussed in the Advanced statistics course
Naive Bayesian Classifier#
In this classifier we use conditional probability to predict a class \(y\) given the values of other attributes \(X\). This is given as :
\(P(y | X) = \frac{P(X | y) \times P(y)}{P(X)}\)
For the sake of simplicity we can ignore the denominator and choose \(y\) based on maximizing
Tags: !AMLIndex